Download Pipeline Insights Dashboard (PDF)
Hinshaw Mortgage Group (a fictional mortgage company) has five branches operating across the United States.
Differing market conditions can make direct comparisons misleading, often hiding the true factors that influence pipeline-wide performance.
This dashboard was created to reduce that noise by focusing on branch level as well as company wide pipeline performance. This dashboard highlights funded volume, fallout behavior, borrower characteristics, and branch trends to reveal the underlying patterns that drive production, fallout and suspense.
The goal of this dashboard is to help stakeholders understand the factors that influence production within individual branches as well as the pipeline as a whole.
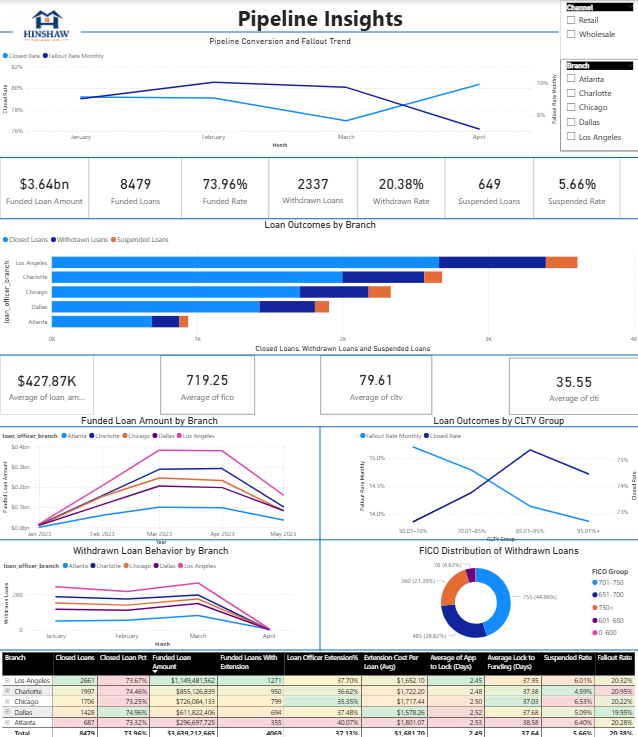
- Total funded loan amount: $3.64 Billion
- Funded loans: 8,479
- Funded rate: 73.96%
- Withdrawn loans: 2,337
- Withdrawn rate: 20.38%
- Suspended loans: 649
- Suspended rate: 5.66%
- Average loan amount: $427,870
- Average FICO: 719.25
- Average LTV: 79.61%
- Average DTI: 35.55%
- Los Angeles leads in funded volume. LA funded $1.15B, the highest of all branches, driven primarily by higher home values rather than operational outperformance.
- Charlotte performs strongly relative to its market. Despite operating in a lower‑cost market, Charlotte funded $748M with a 74.46% close rate, matching higher‑value markets in efficiency.
- Chicago shows the highest suspension rate. Chicago posts the highest suspended‑loan share at ~5.6%, with many ultimately converting to funded loans. This reflects strong conflict‑resolution and borrower engagement by loan officers.
- Charlotte has the highest fallout rate. Charlotte’s fallout rate reaches 19.94%, the highest among branches, with borrowers more likely to cancel outright than enter suspension.
- Retail outperforms wholesale. Retail loans show stronger borrower profiles (average FICO ~719) and lower fallout compared to wholesale.
- Atlanta displays the strongest borrower profiles. Atlanta borrowers show the lowest leverage (average LTV ~79%) and strong credit quality.
- Withdrawals cluster in mid‑tier FICO ranges. 73% of withdrawn loans fall between 651–755 FICO, challenging the assumption that only low‑FICO borrowers withdraw.
- LTV influences fallout more than FICO. The 85–90% LTV band shows the highest fallout rate, indicating leverage is a stronger predictor of cancellation than credit score.
- Funding timelines are consistent across branches. Average lock‑to‑funding time holds steady at ~38 days across all markets, reflecting standardized fulfillment processes.
- Branch performance is tightly grouped. Close rates range narrowly from 73.36% to 74.46%, showing strong process control and minimal operational variance.
- Conventional products have the highest funded volume. Conventional products account for roughly 55% of all funded volume.
Los Angeles produces the largest funded volume in the network. Los Angeles also has closed the most loans relative to other branches. This aligns with expectations give the higher property values in that market. When adjusting for market size, as well as inflation, Charlotte emerges as a standout performer. Charlotte generates competitive funded volume in a more modest housing environment, which suggests that its results are driven by operational efficiency rather than market inflation.
Chicago records the highest suspension rate. This pattern can indicate friction in documentation or underwriting, yet the branch does not show a corresponding spike in withdrawals. Instead, loans are frequently suspended and then recovered. This suggests that loan officers and operations teams are actively working suspended files and successfully moving them toward closing.
Charlotte shows the opposite behavior. It has the highest fallout rate while maintaining a lower suspension rate. Borrowers in this market appear more likely to cancel outright rather than enter suspended status. This may reflect borrower sensitivity to rate movement or competitive pressure. This may also speak to lower conflict resolution amongst Charlotte loan officers and operational teams.
Retail production outperforms wholesale in both funded volume and the strength of Borrower profiles. Retail loans show higher average loan amounts, lower leverage, lower DTI, and stronger FICO scores. Wholesale loans exhibit higher fallout, which may reflect less direct borrower engagement or greater pricing sensitivity. This may also reflect borrower preference, as stronger‑profile borrowers often gravitate toward larger, branded lenders rather than smaller broker shops.
Atlanta displays the strongest borrower profile across the branches. Its loans show higher average amounts, lower LTV, lower DTI, and higher FICO scores. This suggests a healthier borrower base and lower long term credit risk.
Withdrawn loans cluster in the middle of the FICO distribution rather than at the lowest end. Borrowers in the mid tier may be more sensitive to rate changes or qualification uncertainty. This finding contradicts the idea that fallout is heavily skewed towards lower FICO borrowers.
LTV appears to influence withdrawal behavior more than FICO. Loans in the 85–90% LTV range show the highest withdrawal percentage, while loans in the 95%+ LTV range have the lowest. This pattern, along with broader market trends, suggests that borrowers above 95% LTV are often in first‑time homebuyer or high‑LTV programs and therefore have fewer options to shop the market, making them less likely to withdraw.
Funding timelines remain consistent across branches. This indicates a stable and predictable fulfillment process and strong operational control. Atlanta currently has the longest lock to funding time while Chicago currently has the lowest lock to funding time.
This project was built end‑to‑end, starting with data generation and ending with a fully deployed portfolio site. I began by creating market‑accurate synthetic datasets in Python to simulate employee records, loan pipeline activity, and extension behavior. After generating the raw data, I cleaned and standardized each dataset in Jupyter Notebook, then loaded the processed tables into a SQL database.
From there, I wrote SQL queries to model the data and prepare it for analysis in Power BI. Once the data was connected, I built the reporting layer using more than 25 custom DAX measures to calculate funded rate, fallout rate, suspension behavior, borrower characteristics, and operational performance across branches and channels.
The final dashboards were designed in Power BI and exported into a custom portfolio site that I built using HTML and GitHub Pages. The site presents the analysis, visuals, and insights in a clean, interactive format suitable for professional review.