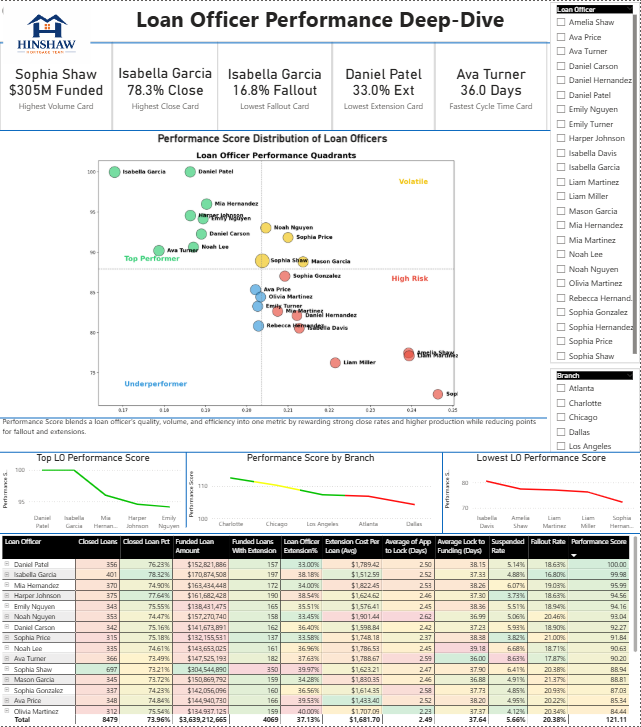
Hinshaw Mortgage Group (a fictional mortgage company) has 24 loan officers operating across five branches, each with different market conditions, borrower types, and production expectations. Because of that, comparing loan officer performance isn’t as simple as looking at who closes the most loans or who has the best close rate. Every metric tells only part of the story, and relying on one of them creates a misleading picture of who’s actually performing well.
To solve this problem, I built the "Loan Officer Performance Score" metric. This metric works by evaluating both componenets of the loan officers job - generating production while maintaining pipeline efficiency. The score rewards the things that matter most—closing loans and driving volume—but it also accounts for the operational behaviors that directly impact profitability, like fallout, suspense, and extensions. Extensions cost the company money and often signal borrower frustration or weak pipeline management, so a true top performer shouldn’t just bring borrowers in the door—they should be able to convert them consistently.
With the score in place, the dashboard makes it easy to compare loan officers by plotting their Performance Score against their fallout and extension behavior. This naturally creates four quadrants that reflect real patterns in how loan officers work. Top Performers score high and keep fallout low—they close a lot of loans and move borrowers through the process efficiently. Volatile officers also produce volume, but their higher fallout or extension usage shows inconsistency in pipeline management. Underperformers maintain clean pipelines but struggle to generate meaningful production. And High‑Risk officers fall short on both sides, with low production and high fallout or extension rates. Because the quadrant lines are based on the team’s median performance score and median fallout rate, the chart adjusts to the actual distribution of the group, giving leaders a clear, honest view of where each loan officer stands.
By combining production metrics with pipeline efficiency, the dashboard turns performance into something measurable and comparable. It helps leaders quickly identify top performers, uncover hidden inefficiencies, and make informed decisions that strengthen both the borrower experience and overall profitability.
- Highest Funded Volume: Sophia Shaw – $330M
- Most Closed Loans: Sophia Shaw – 697 loans
- Highest Close Rate: Isabella Garcia – 78.30%
- Lowest Fallout Rate: Isabella Garcia – 16.80%
- Lowest Suspense Rate: Harper Johnson – 3.73%
- Lowest Extension Rate: Daniel Patel – 33%
- Fastest Lock‑to‑Close Timeline: Ava Turner – 36 days
- Highest Performance Score: Daniel Patel – 100
- Daniel Patel holds the highest Performance Score at 100.00. His 385 closed loans, 76.23% close rate, and 33% extension rate make him the most balanced and efficient producer.
- Charlotte leads all branches in average Performance Score. Charlotte loan officers consistently score above the team median, reflecting strong conversion and disciplined pipeline management.
- Dallas posts the lowest branch Performance Score. Elevated fallout and extension rates across Dallas loan officers pull the branch to the bottom of the distribution.
- Sophia Shaw closes the most loans (477) but carries a 39.97% extension rate. She contributes 8.36% of total closed volume but also 8.30% of company‑wide extension cost, showing her efficiency does not scale with her production.
- Emily Turner has the highest extension percentage at 40.15%. This significantly increases operational cost and reduces her overall Performance Score despite strong production.
- Top Performers combine high volume with low fallout. Loan officers in this quadrant average close rates above 75% and fallout rates below 6%.
- Volatile performers show strong production but elevated fallout or extensions. Many exceed 350 closed loans but carry fallout rates above 21% or extension rates above 35%.
- Underperformers maintain clean pipelines but lack production scale. These loan officers typically close fewer than 260 loans annually despite low fallout.
- High‑Risk loan officers fall below the median on both production and efficiency. They combine low volume (<250 loans) with high fallout (>20%) or high extension usage (>35%).
- Sophia Hernandez has the lowest Performance Score at 72.34. Her 68.36% close rate, elevated suspense rate, and 24.64% fallout rate are the primary drivers of her low score.
- Branch leaders highlight market‑specific strengths. Top performers include Emily Turner (Atlanta), Harper Johnson (Charlotte), Mia Hernandez (Chicago), Isabella Garcia (Dallas), and Daniel Patel (Los Angeles).
- Extensions remain a major cost driver across the team. Loan officers with extension rates above 35% contribute disproportionately to the average $1,618 extension cost per loan.
The Performance Score highlights clear differences in how individual loan officers balance production with pipeline efficiency. While several officers generate strong volume, only a subset convert that volume consistently. Daniel Patel represents the most complete performance profile. His high close rate, low fallout, and disciplined extension usage indicate a pipeline that moves predictably from application to funding. His results suggest strong borrower communication and effective coordination with operations, allowing him to maintain both scale and efficiency.
Isabella Garcia demonstrates a similar level of operational discipline. Her combination of the highest close rate and lowest fallout rate shows that she manages borrower expectations effectively and resolves documentation issues early in the process. Her performance reflects a stable, low‑friction pipeline where most borrowers who enter the funnel ultimately close.
Other high‑volume loan officers show a different pattern. Sophia Shaw leads the team in closed loans, yet her elevated extension rate and disproportionate share of extension cost indicate that her production requires more timeline adjustments and renegotiations. This suggests that while she excels at generating demand, her pipeline experiences more volatility, which suppresses her overall Performance Score. Emily Turner shows a similar trend, with strong production offset by high extension usage that introduces operational cost and borrower friction.
The quadrant distribution reinforces these individual patterns. Top Performers combine high production with low fallout and controlled extension behavior, demonstrating consistent borrower progression through the pipeline. Volatile performers generate meaningful volume but introduce operational risk through higher fallout or extension usage. Underperformers maintain clean pipelines but lack production scale, while High‑Risk loan officers fall below the median on both dimensions, signaling the greatest opportunity for coaching and process improvement.
Loan officers with elevated fallout rates tend to experience borrower disengagement earlier in the process. This may reflect qualification uncertainty, rate sensitivity, or inconsistent follow‑up. In contrast, officers with high extension usage typically keep borrowers engaged but require more time and operational resources to reach closing. These two behaviors impact the Performance Score differently: fallout reduces conversion efficiency, while extensions increase cost and timeline variability.
Extension behavior remains one of the strongest differentiators in Performance Score outcomes. Loan officers with extension rates above 35% contribute disproportionately to the company’s average extension cost as well as overall extension cost. This pattern highlights the financial impact of pipeline inefficiency and underscores the importance of early documentation collection, accurate qualification, and proactive borrower communication.
Overall, the Performance Score provides a clearer view of loan officer effectiveness by combining production metrics with operational behavior. It highlights which officers generate sustainable, efficient volume and which rely on heavier operational lift to close loans. This allows leaders to identify where strong performance is driven by disciplined pipeline management, where volume masks underlying friction, and where targeted coaching can improve both borrower experience and profitability.
This dashboard builds on the same end‑to‑end data pipeline used throughout the project, starting with synthetic data generation in Python and ending with a fully deployed portfolio site. After creating and cleaning the datasets in Jupyter Notebook, the data was loaded into SQL for modeling and then brought into Power BI for reporting. The foundation is the same, but this page adds an additional layer of complexity centered around evaluating loan officer performance.
To move beyond simple production rankings, I developed a custom Performance Score using Python (pandas, numpy, and matplotlib) to test weighting scenarios and validate how different operational behaviors influence overall performance. The score blends production metrics with fallout, extensions, and conversion efficiency to create a more balanced view of how effectively each loan officer manages their pipeline. Once the scoring logic was finalized, it was rebuilt in Power BI using more than 25 custom DAX measures that calculate the operational components behind the score. The score was built to be inherently flexible, allowing weighting adjustments or new operational inputs to be incorporated without restructuring the underlying model.
The dashboard is designed to make these comparisons intuitive. Users can filter by loan officer or branch to see how performance shifts across different segments, and the quadrant chart visualizes how each officer balances production with efficiency. By combining Python‑driven modeling with Power BI’s interactive reporting layer, the dashboard provides a clearer, more accurate way to compare loan officers than relying on funded volume alone.