When a loan is locked, it is locked for a specific commitment period, and that lock is hedged based on the expected timeline. When a loan extends beyond its original commitment period, the hedge can break down—meaning the company may no longer be able to sell the loan for the price it originally expected. In practice, this can result in real revenue loss. Extensions are therefore one of the clearest indicators of pipeline health. They reveal operational bottlenecks, borrower engagement issues, and process inefficiencies that directly affect both profitability and the borrower experience. This dashboard focuses specifically on extension behavior across branches, channels, products, and loan officers to surface the patterns that drive both cost and operational friction.
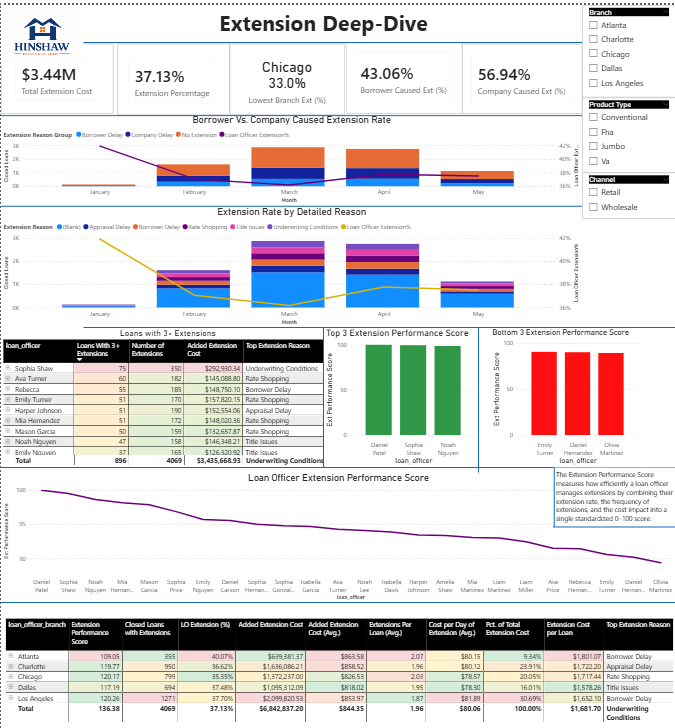
Company‑wide, 37.13% of loans require at least one extension, adding roughly $6.84M in extension cost. These costs can be absorbed by the borrower—often leading to frustration, funding‑to‑close issues, or complete disengagement—or they can be absorbed by the company, which directly reduces revenue. Extensions are categorized as borrower‑caused or company‑caused, with company‑caused extensions accounting for 56.94% of all extensions. That imbalance highlights internal process delays—documentation, underwriting, or fulfillment—that contribute more to extension cost than borrower behavior.
The dashboard also isolates loans with three or more extensions, which almost always indicate deeper issues: pipeline mismanagement, unresolved conditions, or inconsistent borrower engagement. By combining extension percentage, cost, reason, and performance scoring, the dashboard turns extensions into a measurable, comparable operational metric that leaders can use to identify inefficiencies and improve both profitability and borrower outcomes.
- Company‑Wide Extension Percentage: 37.13%
- Total Added Extension Cost: $6.84M
- Borrower‑Caused Extensions: 43.06%
- Company‑Caused Extensions: 56.94%
- Highest Branch Extension %: Atlanta – 40.07%
- Lowest Branch Extension %: Chicago – 35.35%
- Highest Product Extension %: Jumbo – 45.79%
- Lowest Product Extension %: VA – 34.58%
- Wholesale Extension %: 37.66%
- Retail Extension %: 36.77%
- Highest Added Extension Cost per Loan: Atlanta – $863.58
- Lowest Added Extension Cost per Loan: Dallas – $818.02
- Company‑caused extensions are the majority. Company‑caused extensions make up 56.94% of all extensions, signaling internal operational inefficiencies.
- Charlotte has the highest share of company‑caused extensions. At 58.58%, Charlotte’s extension behavior points to internal process delays rather than borrower‑driven issues.
- Atlanta leads in borrower‑caused extensions. This suggests more rate‑sensitive or less committed borrowers in that market.
- Wholesale carries higher extension cost and frequency. Wholesale loans show a 37.66% extension rate and the highest average added cost per extension at $856.95.
- Jumbo products are the most extension‑heavy. Jumbo loans have a 45.79% extension rate. Dallas manages these best with a jumbo extension rate of 40.81%.
- VA products show the lowest extension percentage. VA loans carry a 34.58% extension rate, indicating a smoother process despite documentation requirements.
- Borrower delay is the most common extension reason. This highlights the importance of borrower engagement and documentation coaching.
- 896 Loans with 3+ extensions indicate deeper issues. These loans consistently show operational bottlenecks, mismanaged conditions, or weak borrower engagement.
- Sophia Price has the highest Extension Performance Score. Her score reflects low extension percentage, controlled cost, and strong closed‑loan volume.
- Sophia Shaw adds the most extension cost. She contributes roughly $568,124 in added extension cost.
- Emily Turner has the highest extension percentage at 40.15%. Her top extension reason is rate shopping, indicating uncommitted or price‑sensitive borrowers.
- Daniel Patel maintains the lowest extension percentage at 33%. His top extension reason is borrower delay, but he still closes loans efficiently, aligning with his high performance score.
- Ava Turner and Mason Garcia have the highest extensions per loan. Both average 2.16 extensions per loan.
- Atlanta has the highest added extension cost per loan. Atlanta reaches $863.58 per loan, while Dallas posts the lowest at $818.02.
Extensions sit at the intersection of borrower behavior and operational performance. With a company‑wide extension rate of 37.13% and a total added cost of $6.84M, they represent both a financial burden and a process risk. The split between borrower‑caused and company‑caused extensions shows that internal processes drive more delays than borrowers themselves, with company‑caused events accounting for 56.94% of all extensions. This suggests that improvements in documentation handling, underwriting timelines, and fulfillment workflows could materially reduce extension cost.
Branch‑level patterns reinforce this story. Chicago posts the lowest extension percentage at 35.35%, while Atlanta reaches the highest at 40.07%. Charlotte’s high share of company‑caused extensions (58.58%) points to operational friction, whereas Atlanta’s higher borrower‑caused share suggests more uncommitted or slower‑moving borrowers. At the product level, jumbo loans show the highest extension percentage at 45.79%, reflecting the complexity of larger‑balance loans. VA products, by contrast, carry the lowest extension percentage at 34.58%, indicating a more predictable process once borrowers enter the program.
Loan officer behavior adds another layer of nuance. Sophia Price’s top Extension Performance Score reflects a disciplined approach to managing extensions: lower extension percentage, fewer extensions per loan, controlled cost per day, and strong closed‑loan volume. On the other end of the spectrum, loan officers like Emily Turner and Sophia Shaw generate meaningful production but carry higher extension percentages and larger added extension cost. Emily’s top extension reason of rate shopping suggests a pipeline with more price‑sensitive borrowers, while Sophia’s high total extension cost underscores how frequent extensions compound into real dollars.
The distribution of extension reasons is equally telling. Borrower delay emerges as the largest single driver of extensions, highlighting the importance of borrower engagement and documentation coaching. At the same time, company‑driven reasons such as underwriting conditions, appraisal delay, and title issues show where internal processes can be tightened. Loans with three or more extensions consistently mark the point where these issues converge—operational bottlenecks, unresolved conditions, and inconsistent borrower follow‑through—making them a critical focus for remediation.
By breaking extensions down into borrower vs. company‑caused, product type, branch, and loan officer behavior, this dashboard turns extension data into a practical tool for decision‑making. It shows where extension cost is being generated, which pipelines are most volatile, and which loan officers manage extensions with the greatest efficiency. That level of detail allows leaders to target coaching, refine processes, and align incentives around not just closing loans, but closing them on time and with minimal extension cost.
This dashboard builds on the same end‑to‑end data pipeline used throughout the project, beginning with synthetic data generation in Python and ending with a fully deployed portfolio site. After creating and cleaning the datasets in Jupyter Notebook, the data was modeled in SQL and then brought into Power BI for analysis. The underlying workflow is consistent across the project, but this page adds a deeper analytical layer focused specifically on extension behavior.
To move beyond simple extension counts, I developed a custom Extension Performance Score that evaluates how efficiently each loan officer manages extensions. The score incorporates extension percentage, total extensions per loan, average cost per extension day, and closed‑loan volume to create a more balanced view of operational performance. I used Python to test weighting scenarios and validate how each component influences the score, then rebuilt the final logic in Power BI using more than 25 custom DAX measures. The scoring framework is intentionally flexible, allowing weighting changes or new operational inputs to be added without restructuring the model.
The dashboard is designed to make extension behavior easy to explore. Users can filter by branch, channel, product type, or loan officer to see how extension patterns shift across different segments. Visuals highlight borrower‑caused versus company‑caused extensions, identify loans with three or more extensions, and surface the operational and borrower behaviors that drive added cost. By combining Python‑driven modeling with Power BI’s interactive reporting layer, the dashboard provides a clearer, more actionable view of extension efficiency than raw extension counts alone.